


Internal demand within Europe
The charts below are rolling 14-day indexes of demand for trips requested through the Avinode marketplace within the 4 regions specified. Each chart shows relative demand within the region for 2020 in green, 2019 in dark grey and 2018 in light grey, with day of year along the horizontal axis. Being indexes, the exact figures on the vertical axis are not relevant, although it is worth noting that the axes do start at zero.
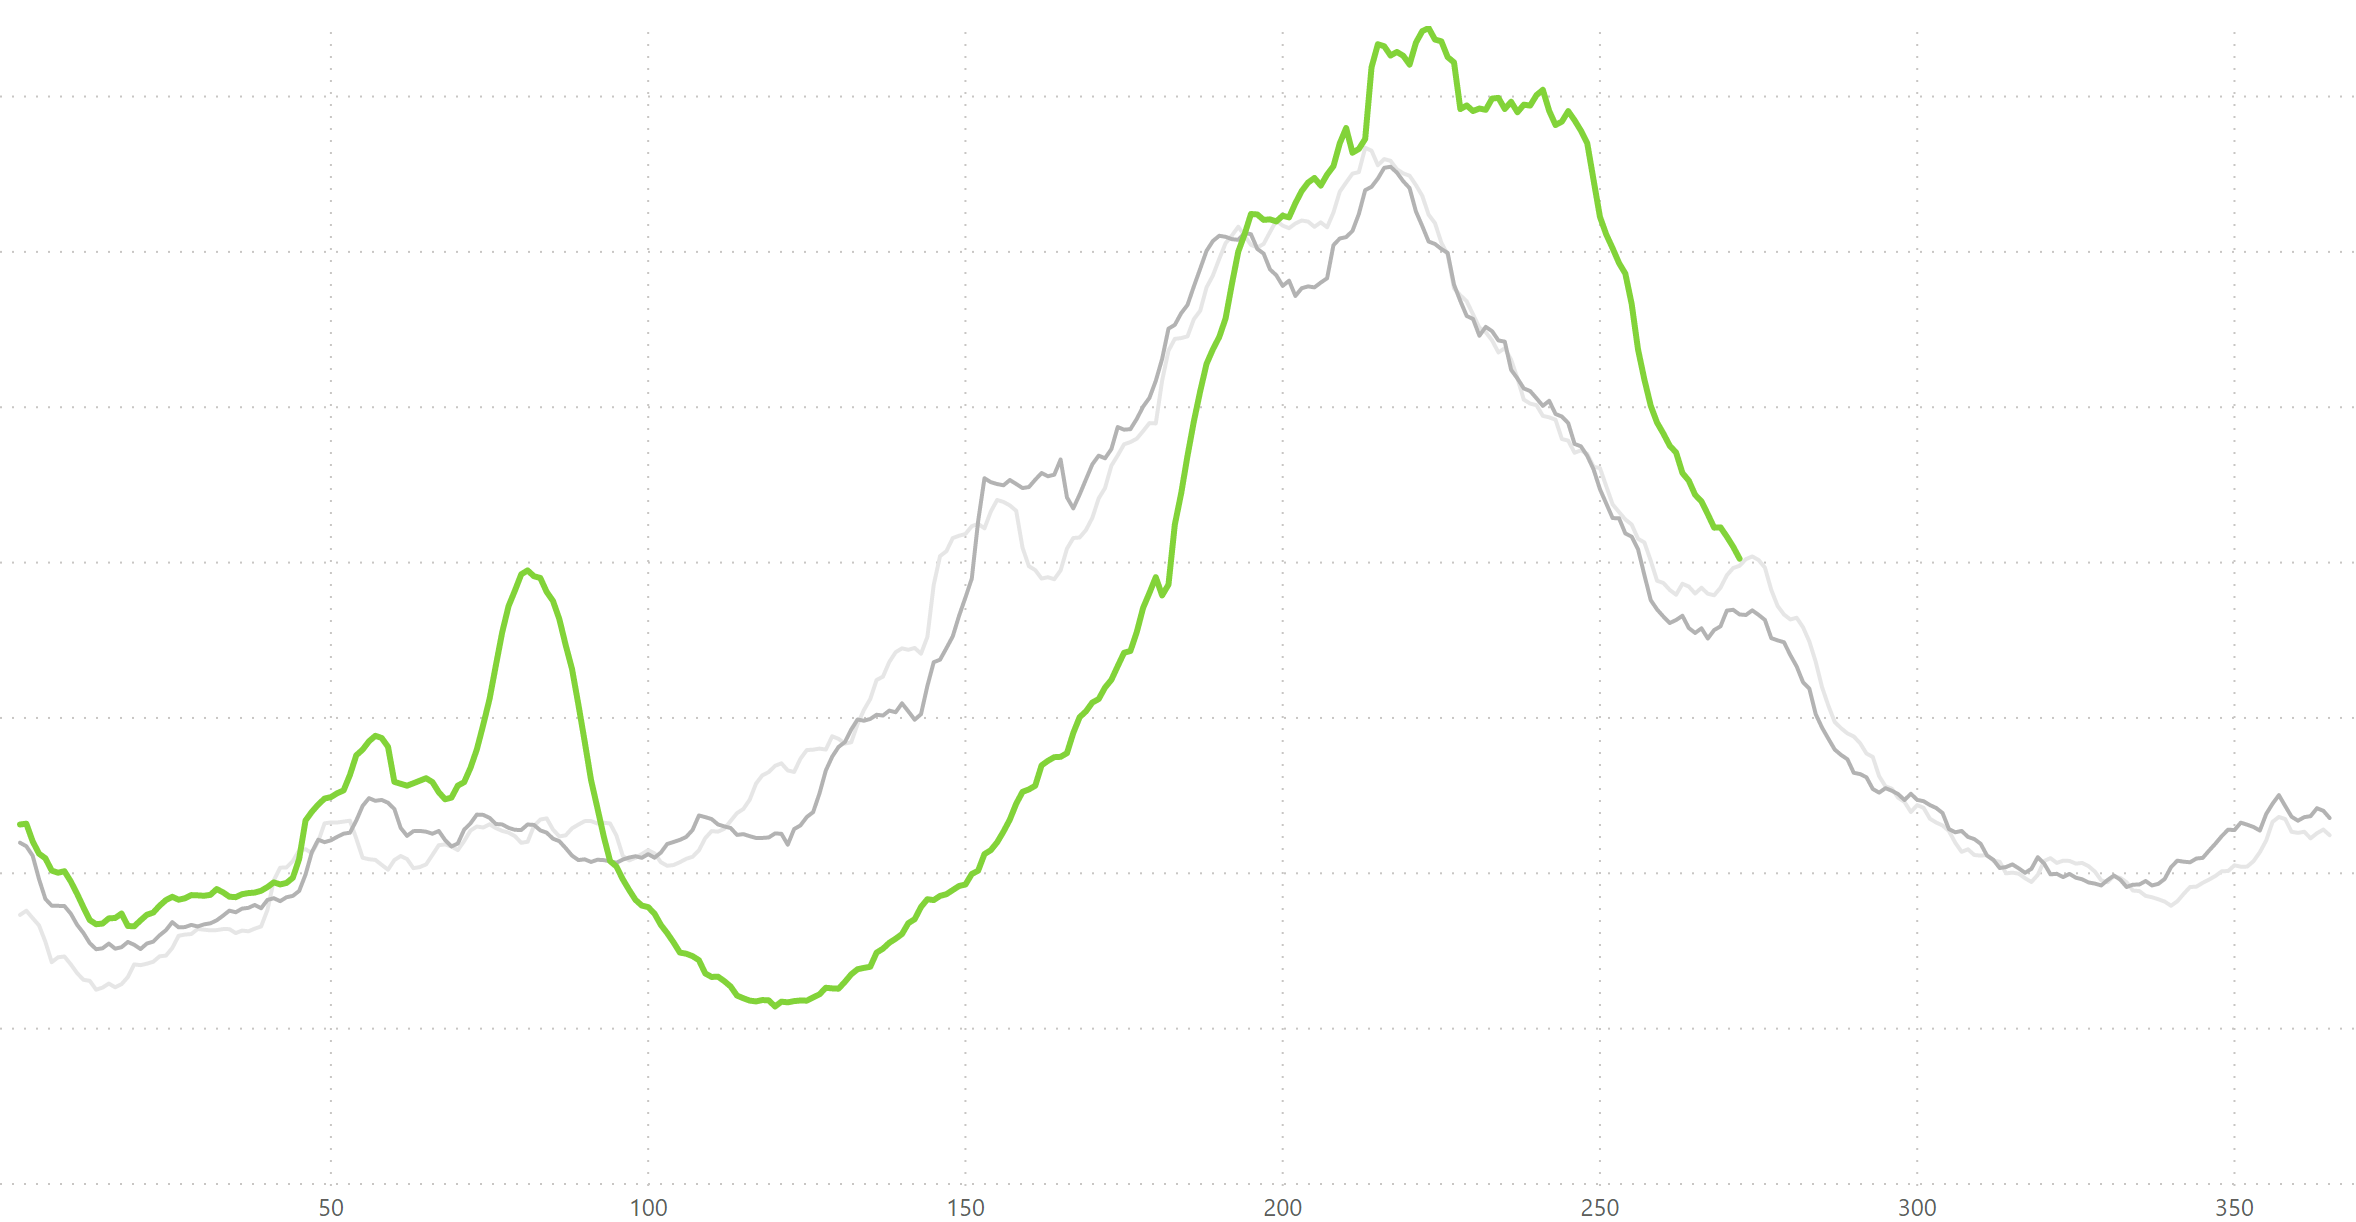
In Europe, seasonal leisure demand was clearly pushed later into the summer. Trip requests fell sharply when the holidays ended, and demand is now more consistent with previous years. Of the major country markets, Germany and Italy have the most positive year-over-year outlooks for the next few weeks.
Demand for travel within Europe looks to be most challenging from mid-November, before recovering as we approach Christmas. Some of that leisure demand looks to be heading Transatlantic. Demand curves to the Caribbean from Europe (and particularly the UK) are approximately 50% ahead of their last year positions for travel from mid-November till mid-December. Barbados, the Bahamas and Saint Vincent are the most requested destinations.
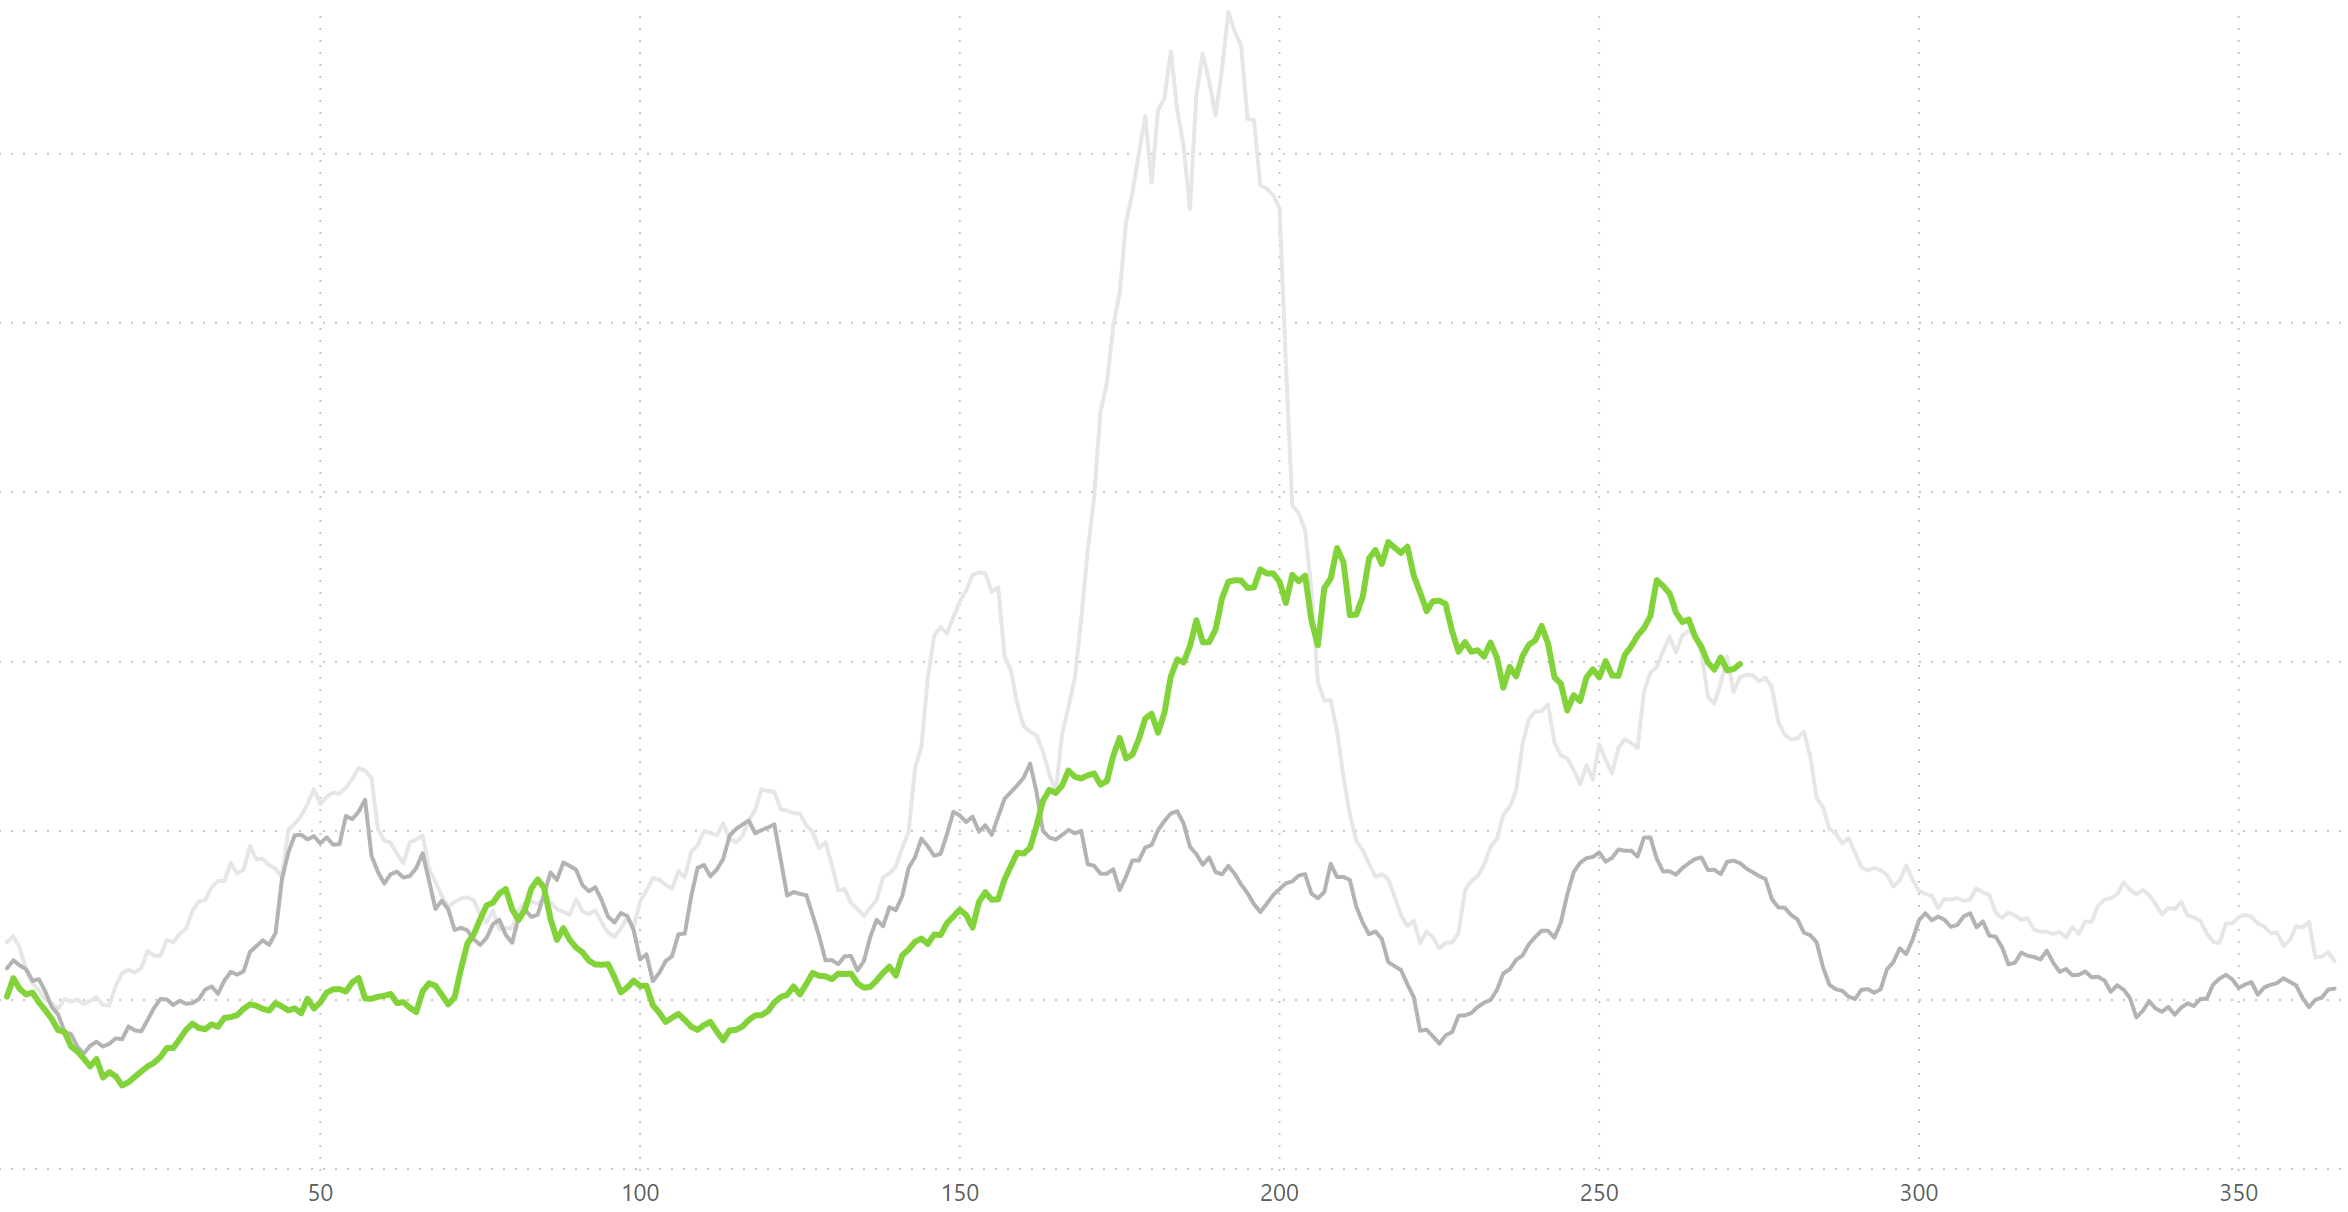
From Russia to Europe
We observed a similar late summer boost from Russia to Europe. Turkey was the biggest beneficiary year-over-year from Russia and demand curves for this country pair are still ahead of last year over the next four weeks.
The biggest upcoming peak for the Russian market is to the UAE around the 24th October, with over 200% more requested trips on this country pair than at the equivalent point last year. The Maldives have an arrival spike the following weekend. Within Russia & CIS, demand has been notably higher during August and September than previous years, although no match for the 2018 World Cup spike.
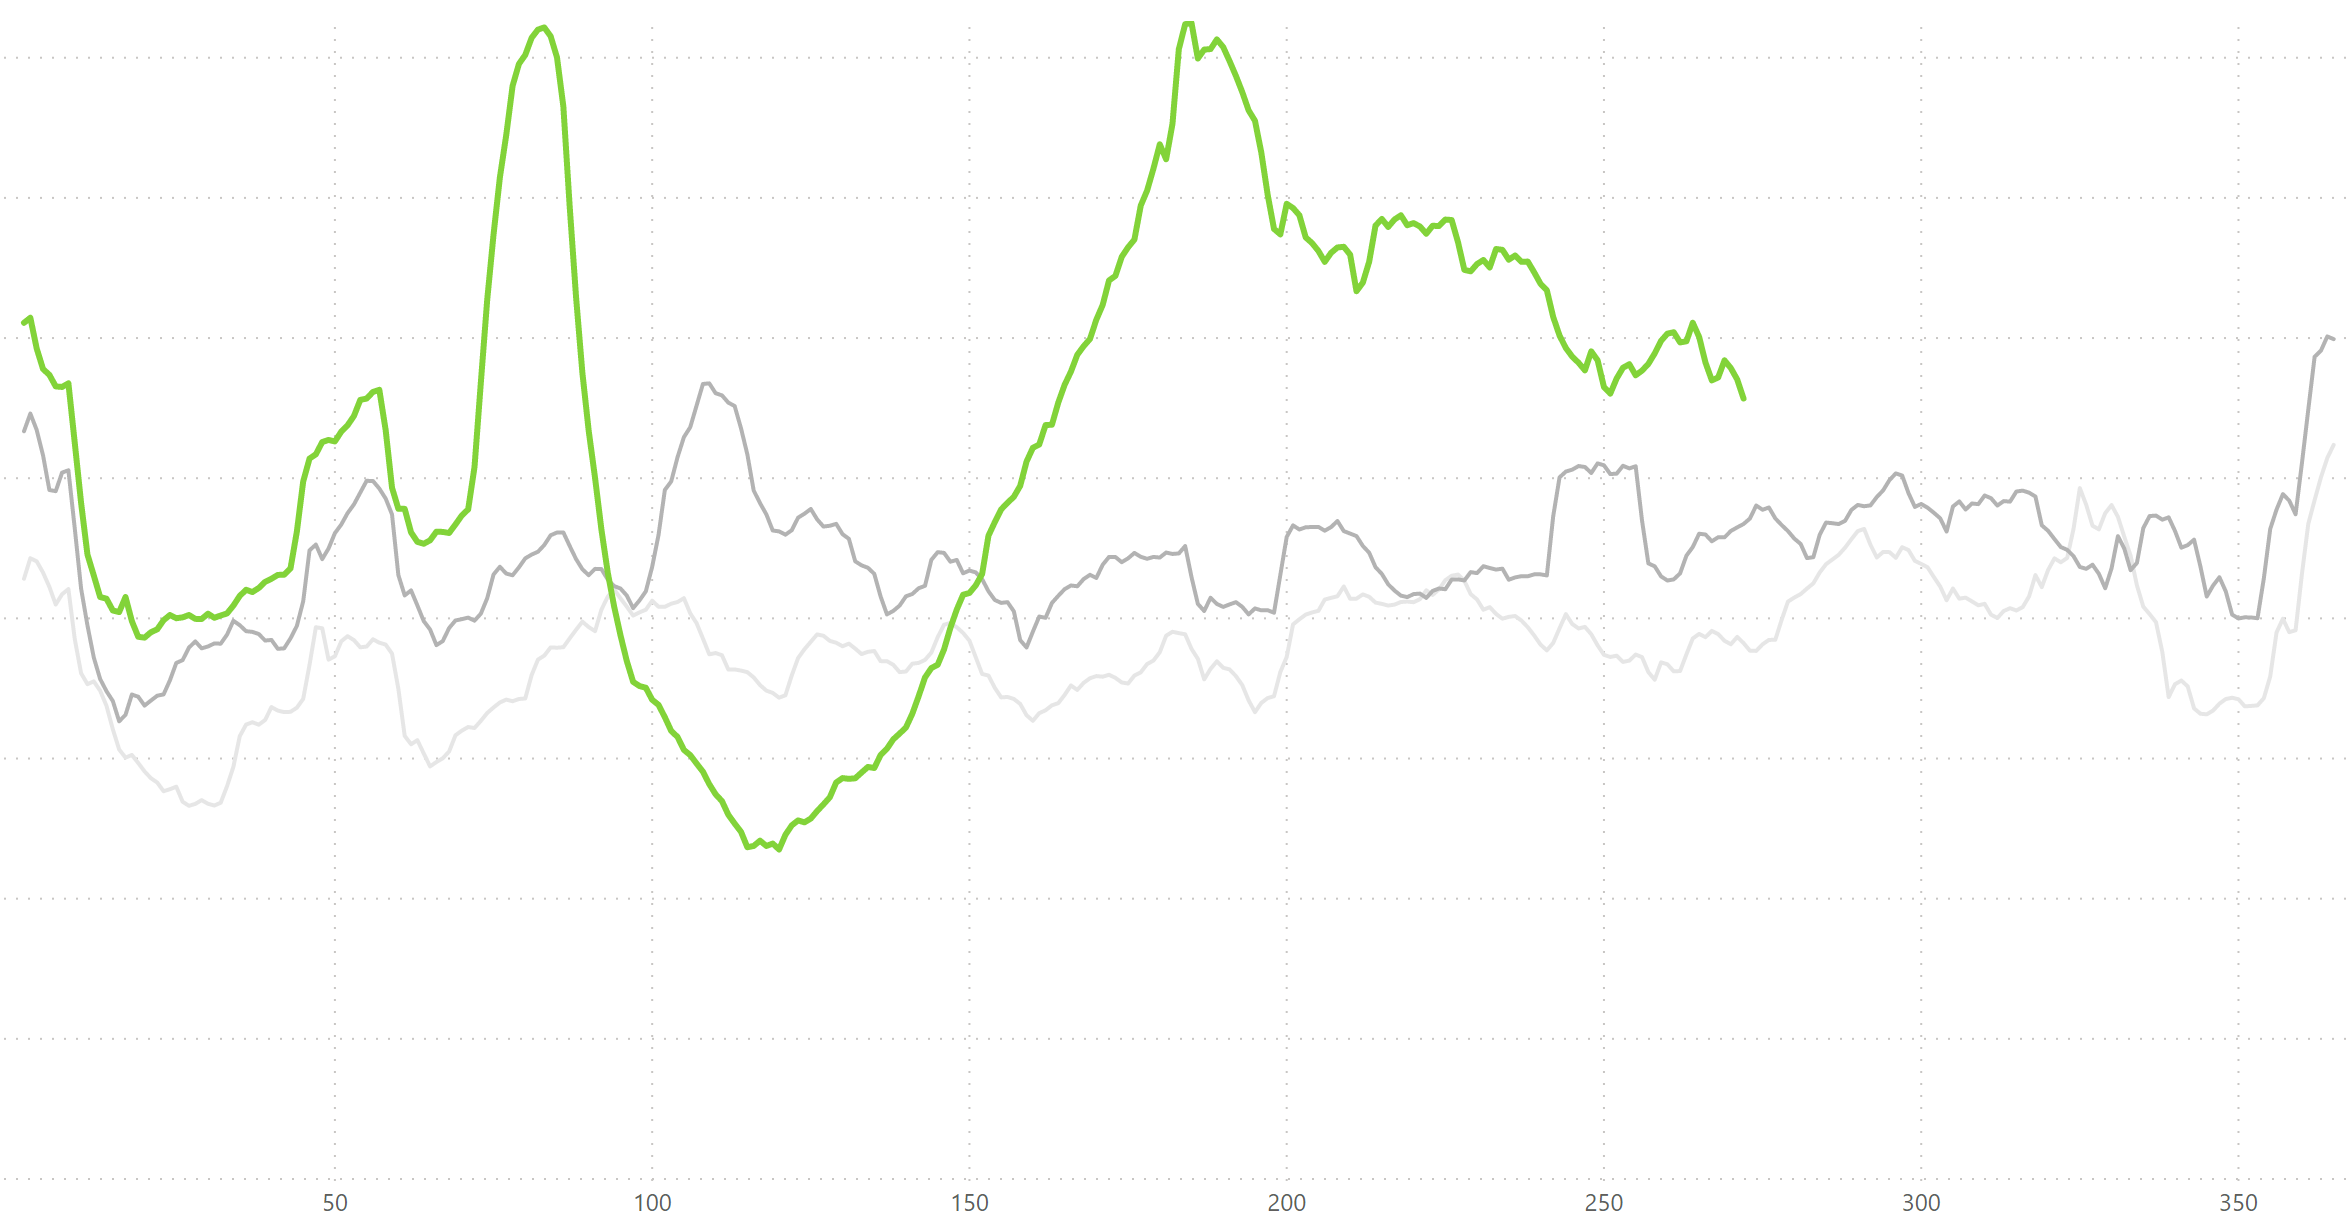
Domestic demand within the US
In the United States, the initial spring peak in demand was matched in intensity by an early summer surge. Since this time, demand passing through Avinode has slowly decreased, but remains at a substantially higher level than in prior years. Many in the industry have commented on a shift in the passenger make up to first time private flyers, travelling for leisure, rather than businesspeople. New flyers’ enquiries have probably contributed to this increase in demand through Avinode.
Looking forward, demand curves for US domestic travel are slightly ahead of last year’s level for the next 5 weeks. The markets driving this behaviour are the East Coast corridor to and from Florida, as well as a notable year-over-year increase in travel to remoter states. Trip requests for departures to and from Montana, Idaho and Hawaii have all increased by over 100%, with Wyoming and Colorado not far behind. Demand to states in the Mountain time zone is highest from the Northeast US – but is elevated from all corners of the country. Demand for shorter flights is still down.
Internationally, there are positive trends for travel to Latin America from the US for the next six weeks, mostly driven by trip requests to Mexico. Other popular destinations are Costa Rica, Sint Maarten and the Turks & Caicos islands. Unfortunately, the major US – Bahamas market is still seeing fewer trip requests than last year.
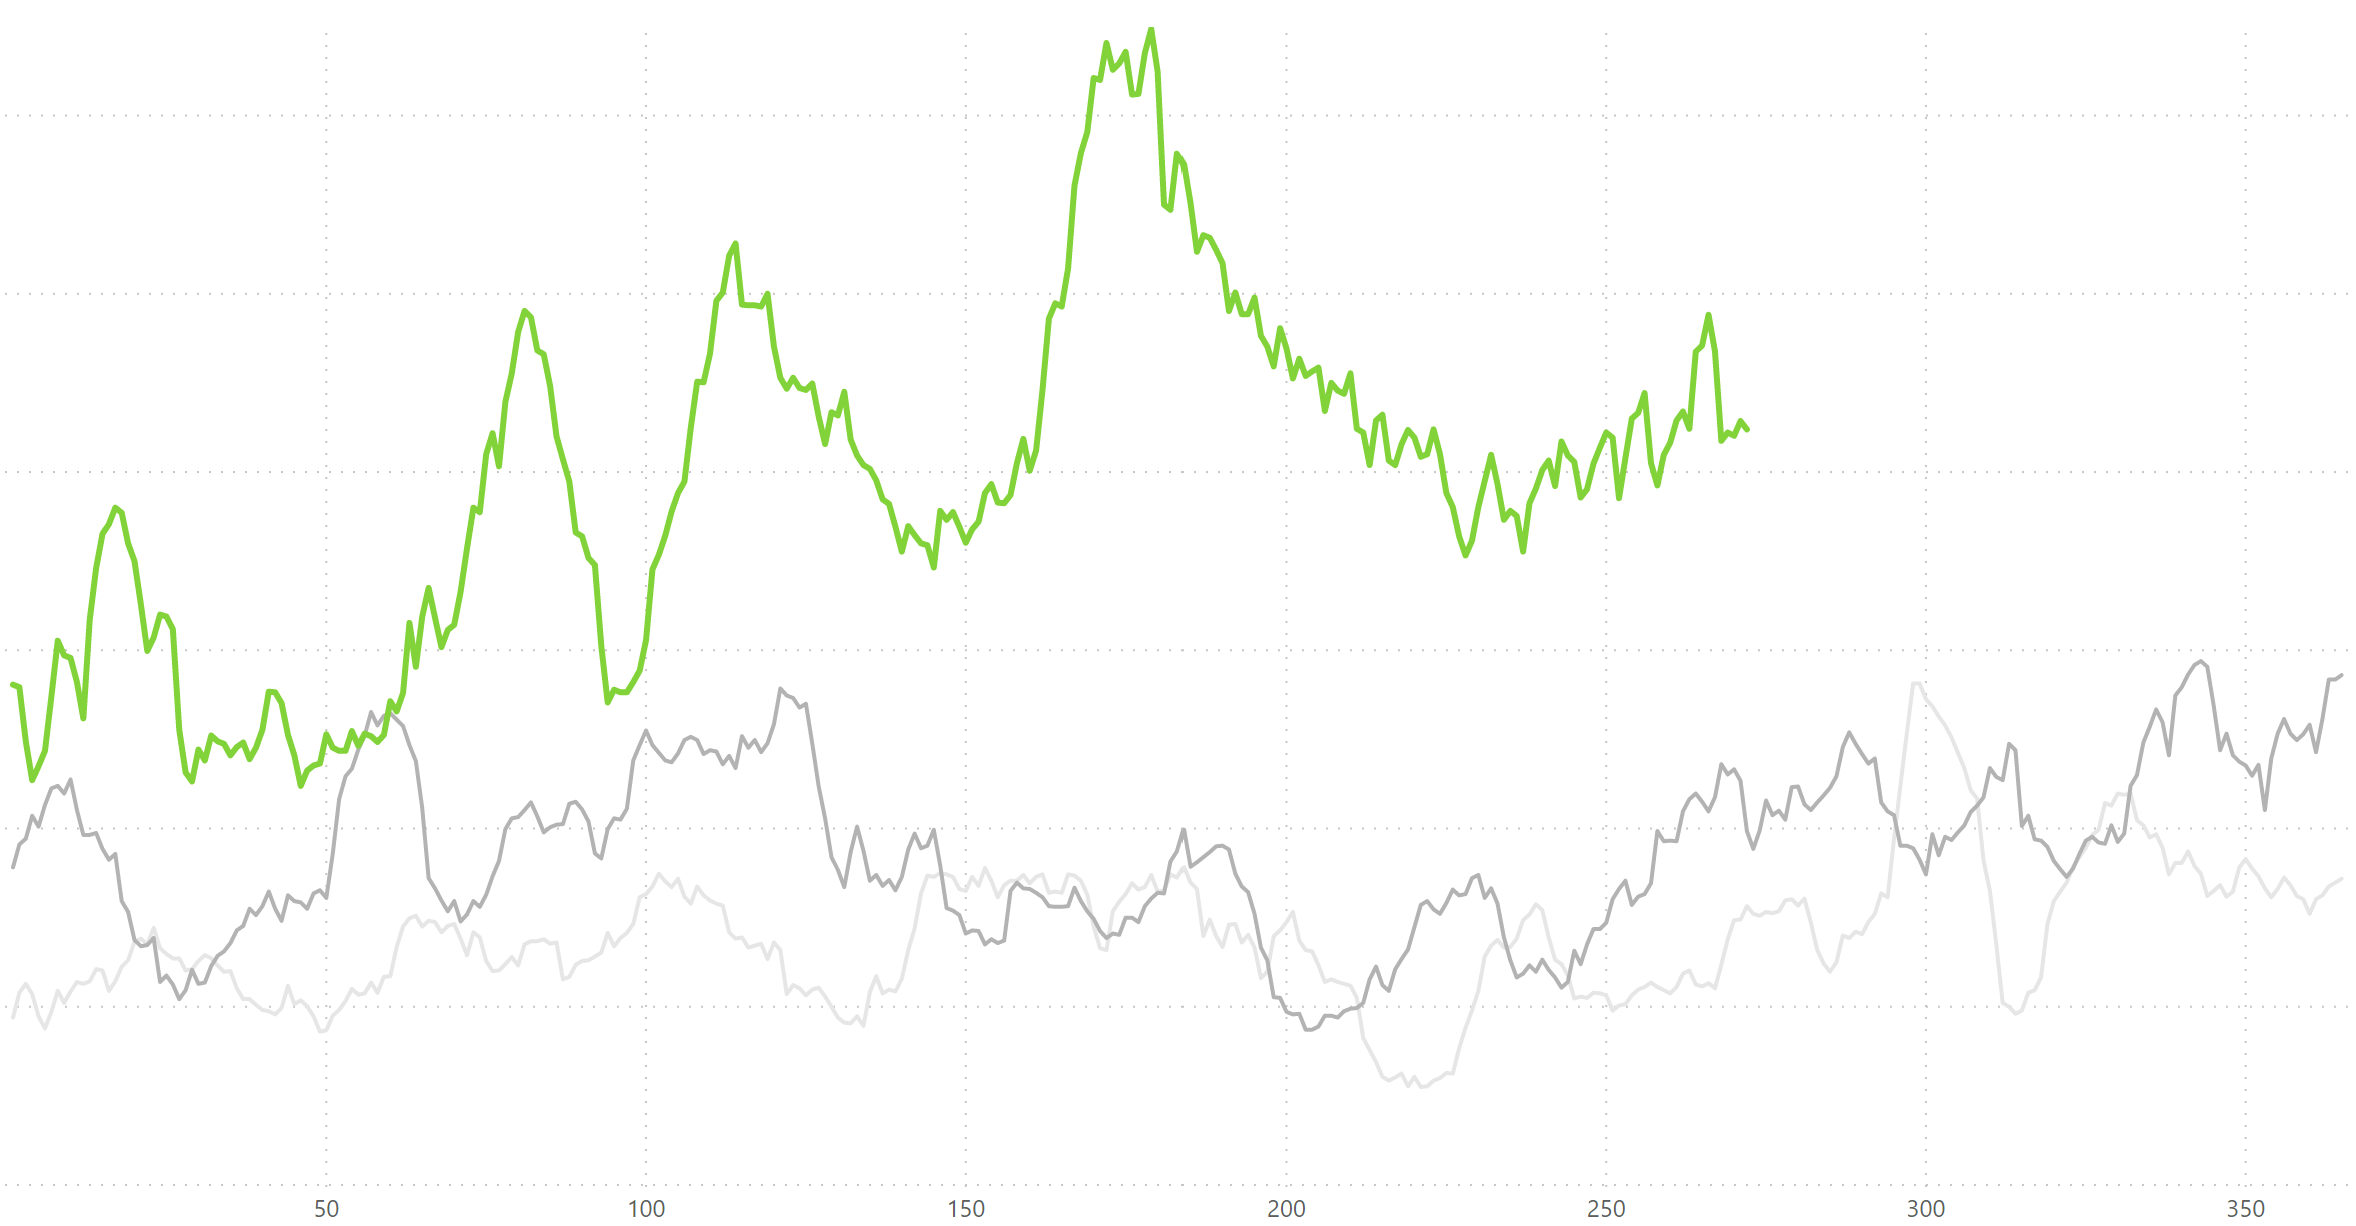
Internal demand within the Middle East
Trip requests through Avinode for travel within the Middle East has been much higher than previous years, as shown in the chart. Increased charter demand from the UAE has driven this, particularly to Saudi Arabia. Looking forward, there are major demand peaks forming from Dubai around the 1st and 8th November for travel to Russia, matching the flow in the other direction a week earlier. A smaller demand peak to the UK is appearing around the 31st October.
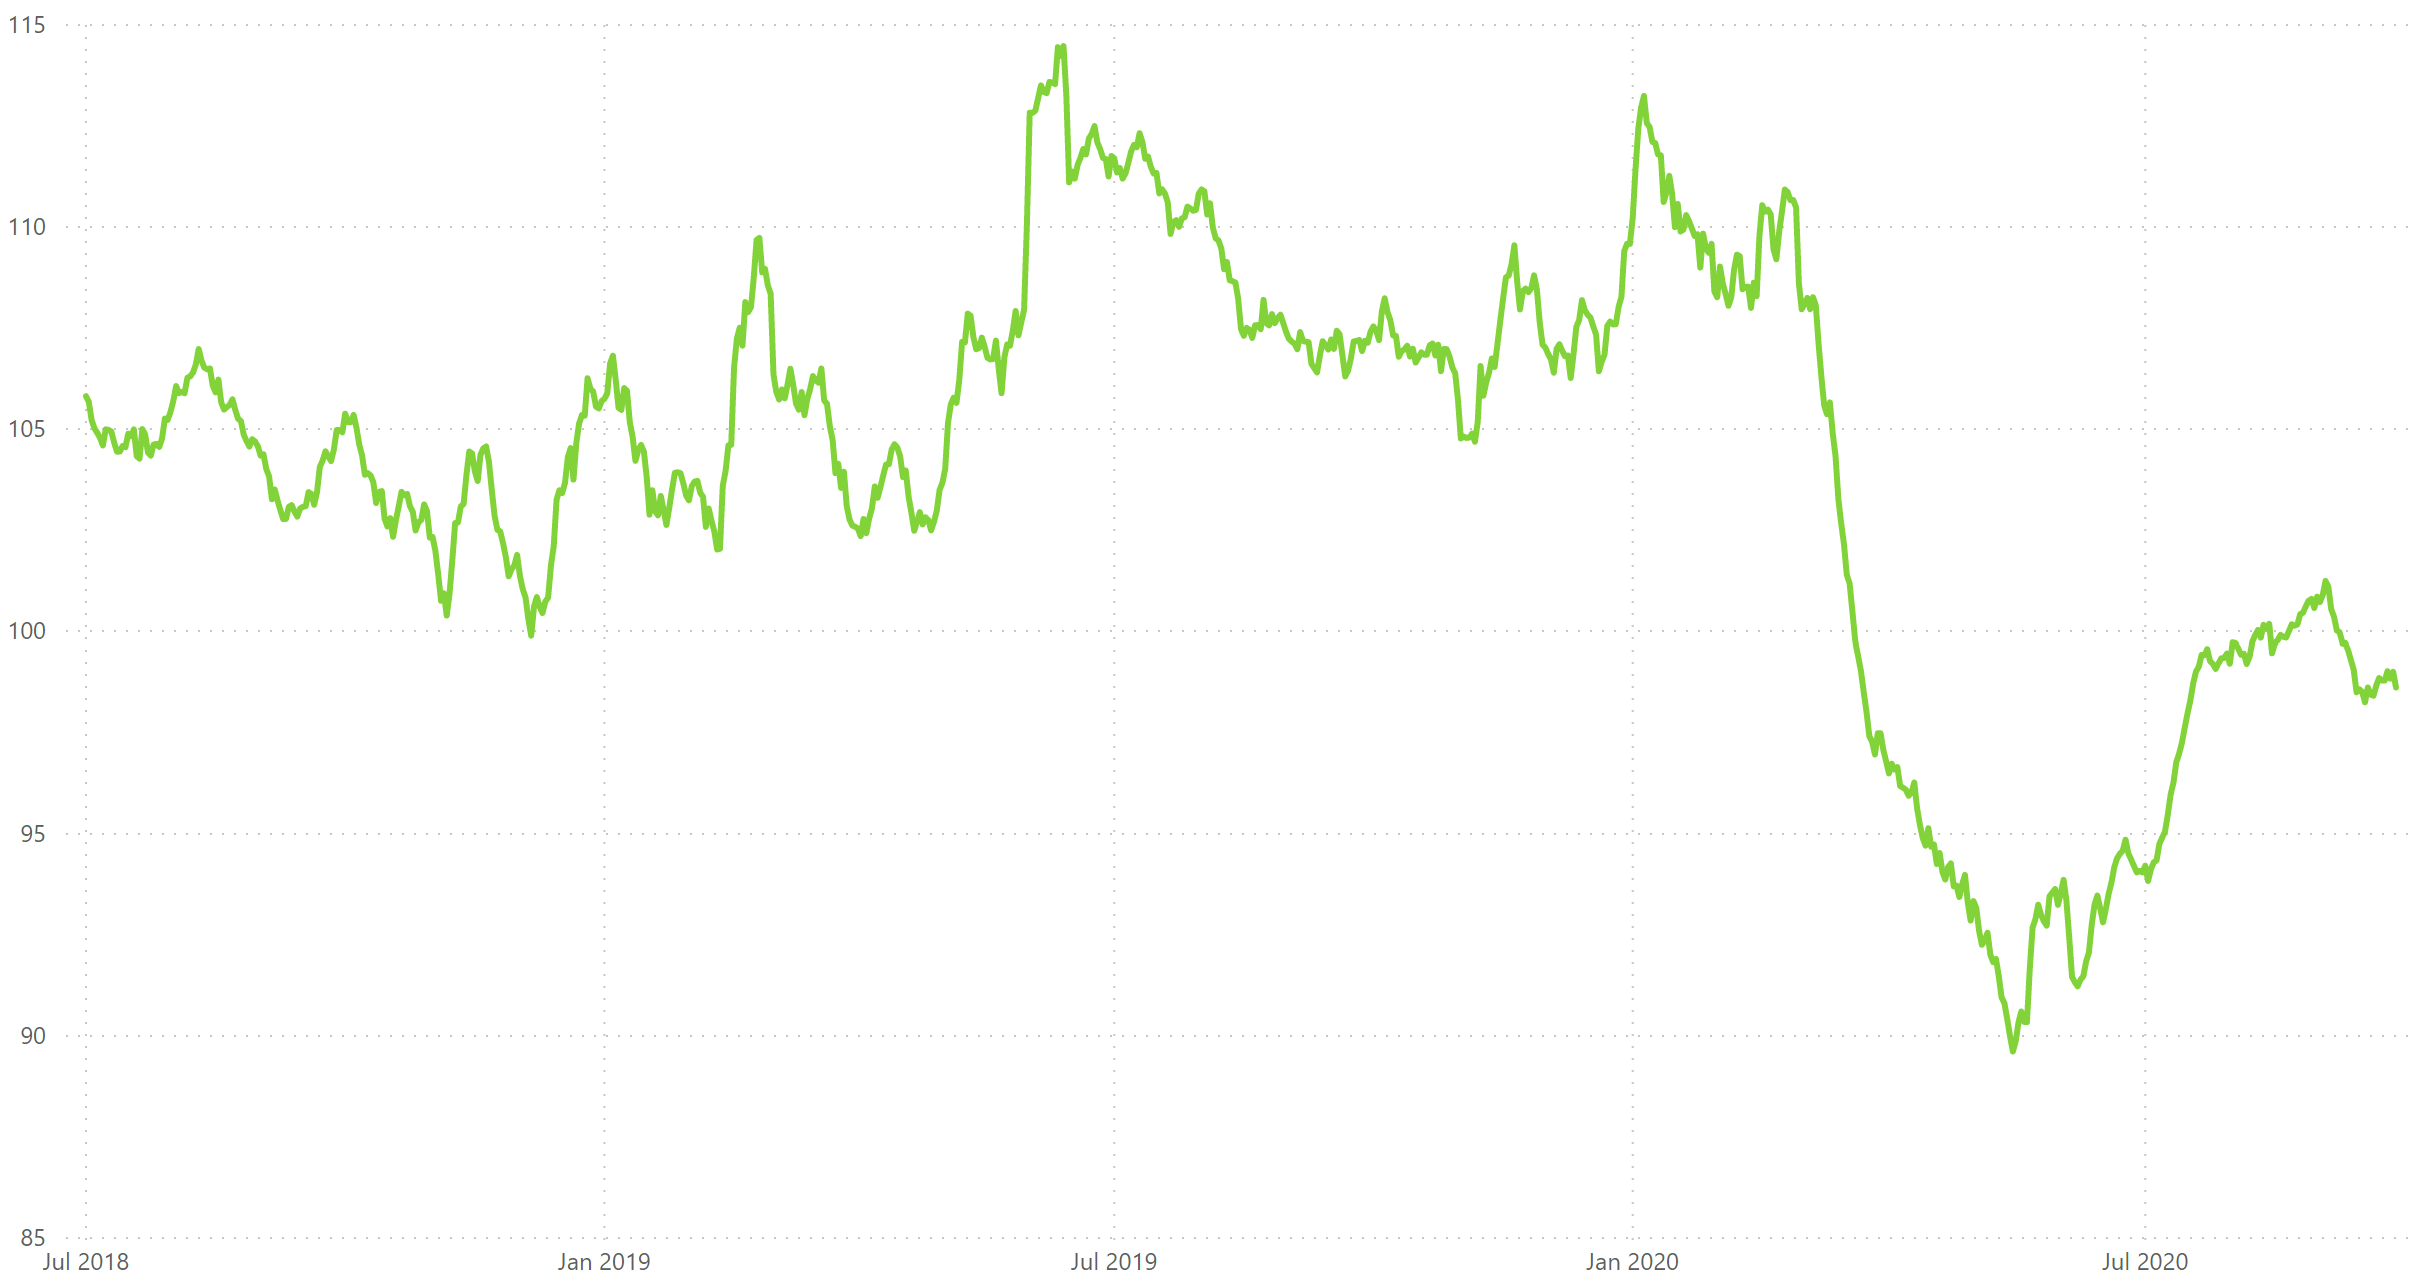
Intra-European pricing index
Charter rates have adjusted to reflect the shifting demand environment. The above chart is a rolling 14-day price index based on quotes in the Avinode marketplace, normalised to 1st January 2018, for travel within Europe. There was a steep and sudden fall in hourly rates during the spring which recovered somewhat due to returning demand in August. Rates have recently settled slightly lower than that level. Entry level jets have beaten the trend, with hourly rates now similar to pre-COVID levels.
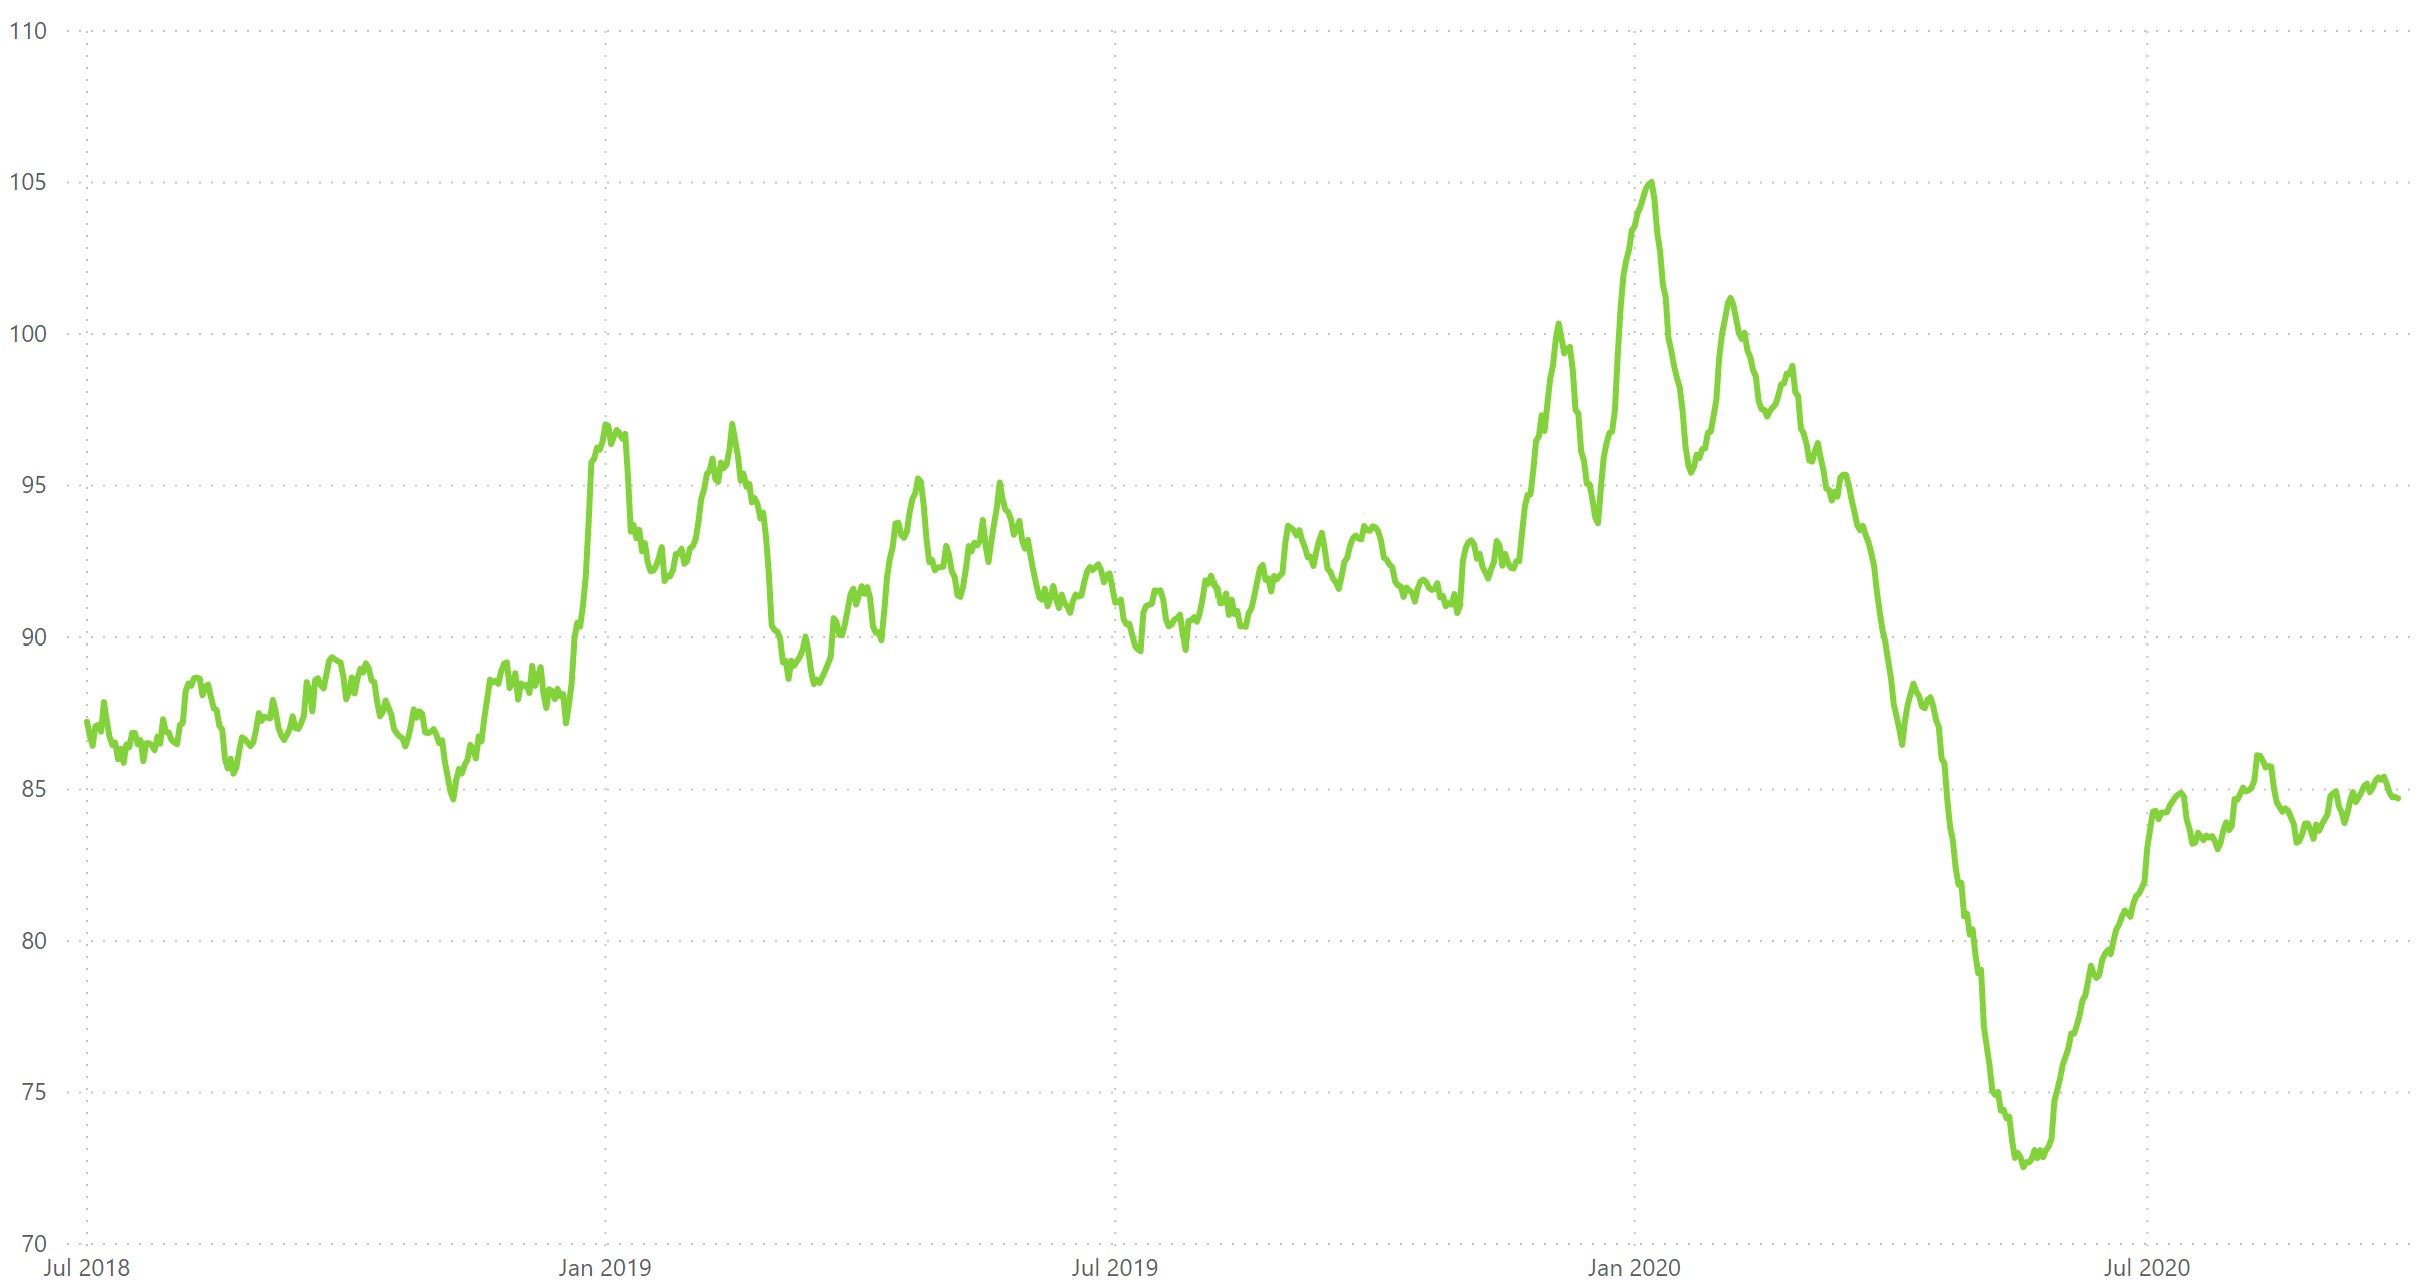
US domestic pricing index
In the United States, the drop in hourly rates during the immediate aftermath of travel restrictions was greater – although this was heavily influenced by a very significant decrease of 29% in hourly rates for super midsize jets. They have now recovered to only 1% below pre-COVID rates, outperforming most other categories.
The summer taught us that leisure demand increased quickly when travel restrictions were lifted. The return of business travel looks to be a more gradual process. It remains very challenging to predict what patterns will emerge as we head towards winter in the Northern Hemisphere.

Harry Clarke,
Head of Insight, Avinode Group